Sometimes ignorance is bliss. If you spent the first six months of the year in hibernation and are just waking up to review your investment statements, you would probably be inclined to yawn and conclude that you didn't miss much. The overall results for the markets through the midpoint are slightly negative but within shouting distance of the breakeven mark. However, most investors are breathing a sigh of relief to be back to these levels after a vicious and historically fast bear market where we saw the S&P 500 drop 34% in a five week period. This bear market was followed by an equally historic bull market run that has returned a few individual stocks and indexes to fresh new highs. For instance, the tech-heavy Nasdaq sits up 16% year-to-date.
In light of the severe economic and health impact that COVID-19 has caused, many people have asked us why the stock market has gone up so aggressively. Or, how can this make sense with millions of job losses and a steep decline in GDP? The answer is two-fold. First, stock market performance doesn't equal economic performance. We may be experiencing first-hand the biggest bifurcation between those two elements that has ever been recorded. While these two typically have a strong correlation in their trajectory, sometimes there is a temporary dislocation. In this case, a lot of the economy is driven by small businesses, which are suffering greatly as COVID-19 and government lock-down orders have shuttered stores and kept customers at bay. When we think about the stock market, typically we refer to the S&P 500, which represents the largest 500 publicly traded companies. These businesses generally have greater flexibility due to their scale and can more easily transition to digital offerings, adapt to logistic changes, and have better access to capital, either by selling more stock, issuing debt, or by obtaining bank loans due to their relationships. Although many of these businesses were also damaged by COVID-19 (especially those in the travel & leisure sector), largely they have been able to continue operations. In some cases, they are even gaining market share by taking a piece of the economic pie by filling demand not served by small businesses.
Another reason for the disparity between the economy and stocks is that job losses and GDP are a lagging indicator while the stock market is a forward looking indicator. Most of a stock's value is inferred by its future earnings potential. While many companies are having a terrible year, the stock market seems to think this is a short-term phenomenon and that normalcy will come sooner than later. Instead of basing valuations on 2020 revenue and earnings, Wall Street and investors seem content to look forward to 2021 or even 2022 when considering a company's value.
Now that we've addressed the reasons for the disparity between the stock market and the economy, let's take a look at how the economic recovery is likely to play out. If you have listened to many financial pundits, you are sure to have heard an alphabet soup of economic recovery descriptions. To anticipate the market's next move, you somewhat have to place a bet on one of these letters. So, let's review the most likely options:
"V" Shape Economic Recovery—Given that second quarter market results are some of the best since the dotcom bubble of the 90's, the stock market seems priced like we are going to see a "V"-shaped economic recovery. That means that after this aggressive economic downturn, where we saw GDP fall 5% in Q1 and likely much worse for Q2, we may see an equally aggressive swing back up.
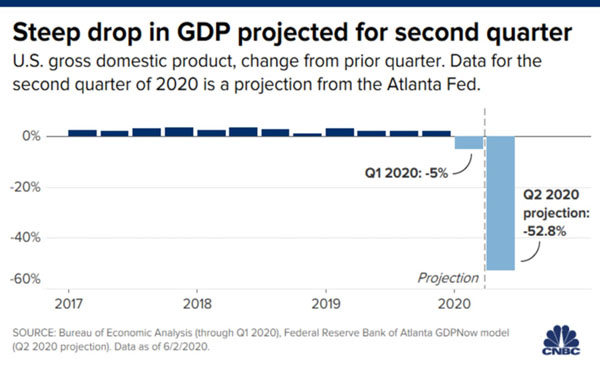
The basis for the "V" shape recovery primarily hinges on how much long-term economic damage was done. Since the recession was government-induced by forced closures and stay-at-home orders, if we flip the switch back on, then businesses should be back to normal. This argument supposes that the nature of the recession can be reversed quickly, unlike the 2008 recession, which did massive long-term damage to the banking and real estate sector. Those business models were highly levered and took the better part of 10 years to recover. That hindered a significant recovery out of the recession of 2008. If we are to see the "V" shaped outcome, government stimulus efforts will have kept businesses afloat long enough to survive and allow consumer demand to pick up right where it left off as soon as the threat of COVID-19 is eliminated or at least significantly reduced. Accordingly, the market is probably priced correctly if a "V" plays out.
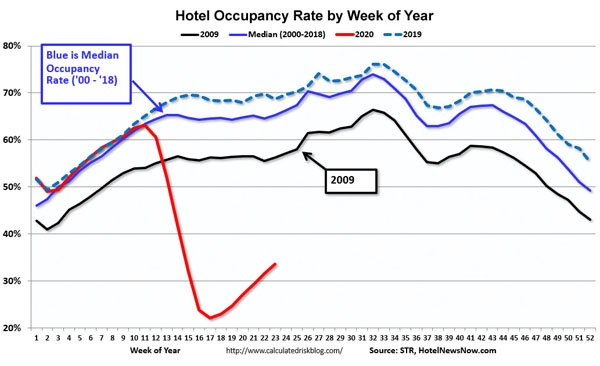
"U" Shape Economic Recovery—In this scenario, the economy will eventually recover to its pre-crisis level, but will spend some time at the bottom before a true lift-off occurs. If a "U" shape recovery occurs, it is likely due to the profound damage done to the travel and leisure portion of the economy. During the March market lows, this sector, along with energy related stocks, sold off around 70-80%, and most of their debt was trading at levels associated with eminent bankruptcy. As travel demand cratered, hotel occupancy rates dropped to around 25% in April. While there has been a slight bounce off these lows due to various state re-openings, vacancy rates are still 30% below where they typically are this time of year. The same story has played out for the airline industry. The CEO of American Airlines said they flew at 15% capacity in April and that increased to just 20% in May.
Whatever hope there was for a quick turn around in the travel industry has been squashed by government regulation, the work from home dynamic, and a significant change in consumer behavior that will most likely last for years, not months. While some sectors such as technology are experiencing the "V"-shape recovery, because of the damage being done to the travel industry, the economy and GDP are likely going to need two years or more to return to 2019 health. Accordingly, the market is likely 10-15% over-valued if the "U" plays out.
"W" Shape Economic Recovery—It isn't talked about much, but we consider this to be the most dangerous path for investors, and a significant reason for increased cash in your current asset allocation. The "W"-shape likely would mean that we have a resurgence of COVID-19 cases that cause additional forced closures later in the year. The subsequent fall in economic activity may be too much for a split congress in an election year to overcome, and this time, the stimulus safety net might not be enough to keep the economic recovery intact. Accordingly, the stock market would not look too kindly on this scenario and could re-visit the March lows if the "W" plays out.
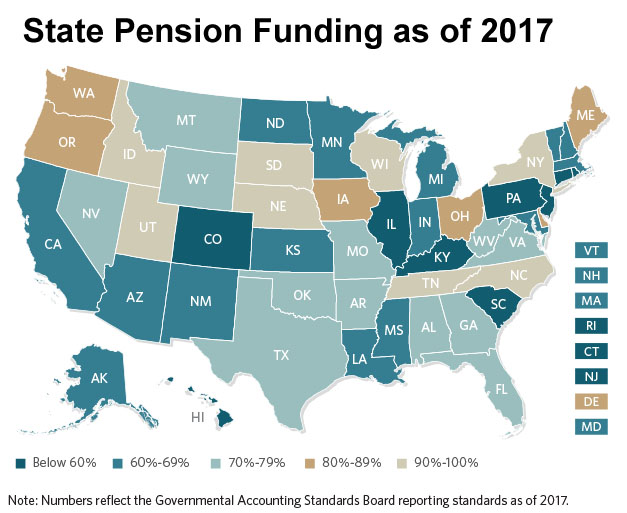
We do not currently feel like this scenario is overly likely, but in our opinion, the "unexpected" insolvency of one of the 50 states is the most plausible scenario to cause such a chain-reaction sell-off. During this recession most states and municipalities have seen a downturn in tax revenues. Couple that with increased expenses to cover healthcare and unemployment costs, and you've got a scenario where states are stretched pretty thin. Unlike the Federal government, municipalities can't just issue their own currency to balance the ledger. As sales tax, occupancy tax, gasoline tax, arena and convention center revenues, etc. are way down, it will be even more difficult to overcome the legacy pension issues that have been weighing down budgets for what seems like forever.
The Federal Reserve has been doing an array of emergency bond purchases and other activities to support the fixed income market over the past three months as part of the CARES Act. Part of the emergency provisions are potential loans to municipalities under the Municipal Liquidity Facility program authorized for up to $500 Billion. Although this facility has only been utilized by one state up to this point, Illinois, we would not want to see heavy-usage, as that would point toward greater looming issues. We put the odds of a state insolvency at around 10-15% during this recession, with the odds greatly decreasing if we see a "blue" wave in November as the Democrats seem more inclined to support a Federal bail-out of state balance sheets.
Our advice right now is to plan for the "U" shape recovery, but have parts of your investments geared towards both the "V" and "W" scenarios as well. This means the lower risk part of your portfolio should be heavier in cash, but your equities should have some exposure to sectors that were beaten up badly. At some point this year, almost all investors thought about selling everything and running for the hills. That strategy rarely works. Betting on America and the world to keep going has been the better investment for the last 100 years and is most likely the best course of action this time around regardless of what your alphabet soup spells out.